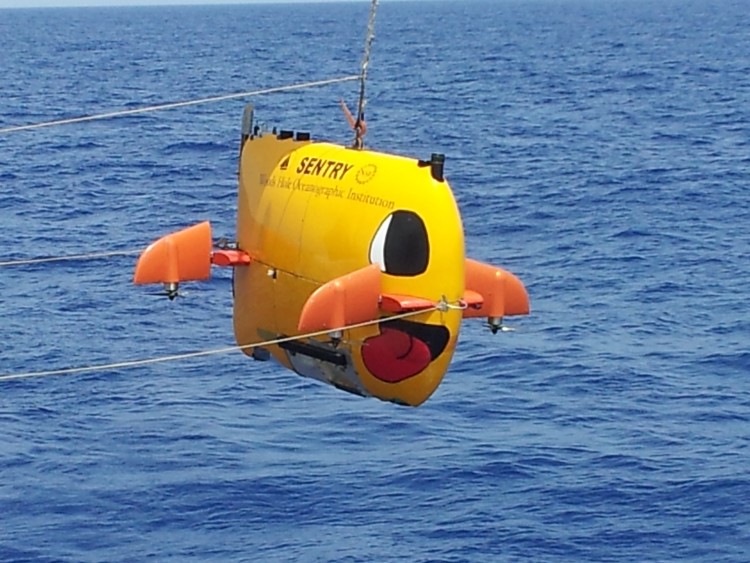
The Sentry AUV is WHOI's homemade AUV platform. It has similar equipment to other AUVs on the market such as edgetech's combined sidescan/sonar and a Reson multibeam. I'm not sure what control systems they use, it's probably a WHOI special. The main difference is that the AUV has a flat fish shape which supposedly helps it ascend and descend faster. It is certinaly a one of a kind AUV.
I was able to connect with NOAA and get a copy of the AUV dataset. They actually fedexed a harddrive with the data (and paid for the return too). The sonar dataset came as navigated .jsf files, photos of the seabed, and a few gridded bathymetric files. The jsf files didn't load right in sonarwiz so I had so manually convert the jsf to XTF and segy files using edgetech's discover software.
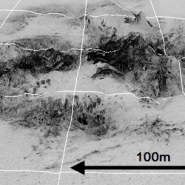
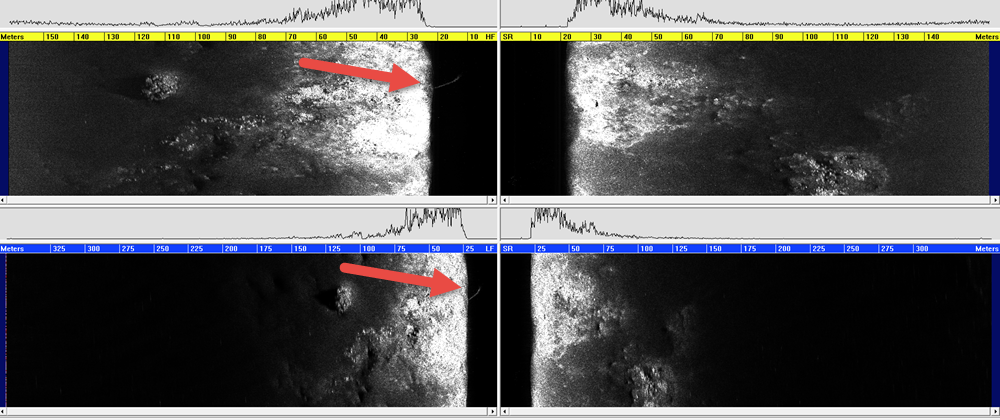
I loaded the XTF files into sonarwiz and ran the normal workflow of bottom tracking, gaining with the EGN gain, and then playing with the mosaic so that it looks acceptable. You can see some noise in the geotiff and a few areas that aren't perfect. However the main feature, a area of hard grounds and seeps, is easily visible (dark area on the mosaic)
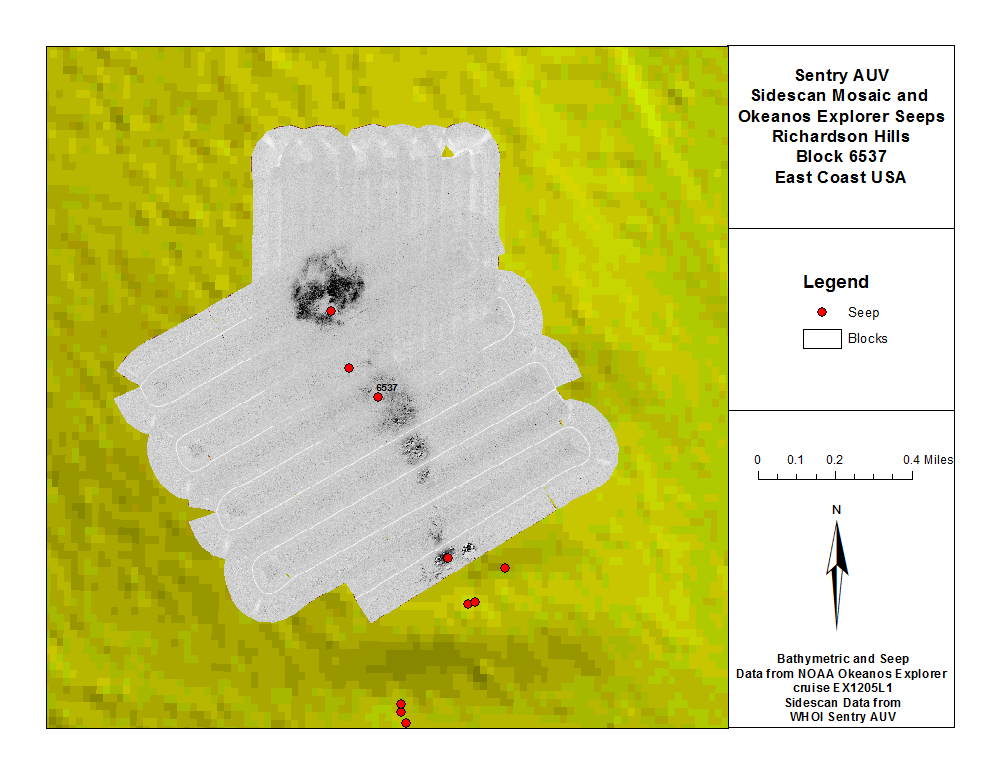
A few active seeps were visible in the nadir of the sidescan. The AUV has to pass directly above the seep for the sidescan to image it – so this isn't the best detection method. However it is nice to see as a observation. In this example the colors of the sidescan are reversed as to how I usually like them. White is a strong reflection and black is the absence of acoustic energy.
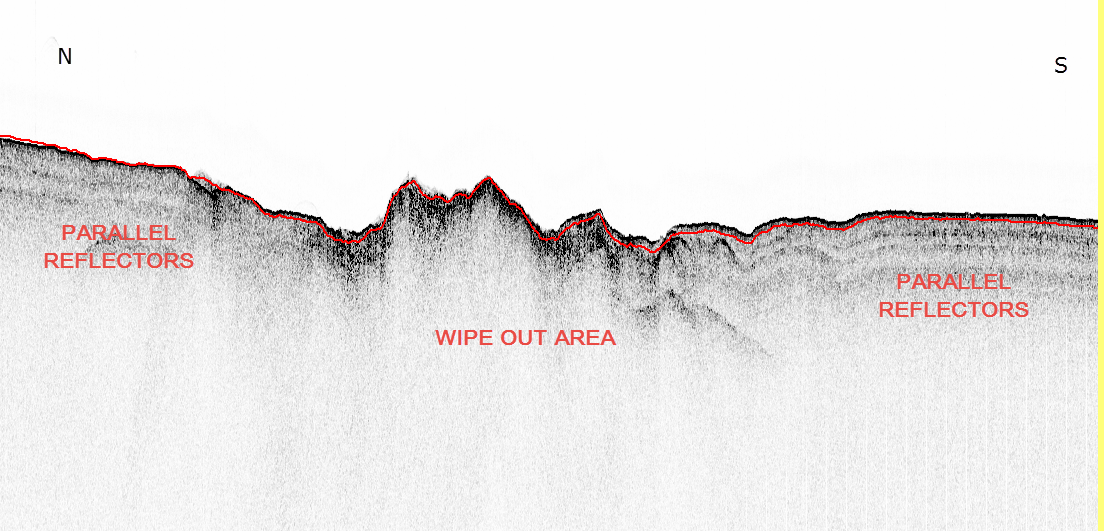
The sub bottom in this dataset wasn't as clear as I the data from the Gulf of Mexico. However it is still easy to see the acoustic “wipe out” signature that is caused by gas in the sediments. Directly below the hard grounds you can see a chaotic pattern in the sub bottom data. Away from the hardgrounds, parallel reflectors become visible as one would expect from normal sediment deposition.
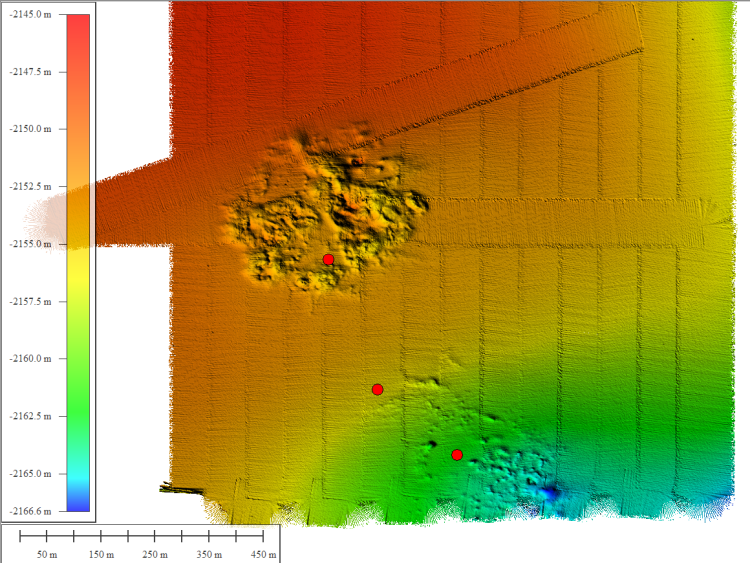
The bathymetric data in this area is interesting. The hardground area looks to be a series of pockmarks surrounded by higher bits of seafloor and rock. Because of vertical exaggeration this area looks to have considerable relief, however; it is only a few meters at it's highest.
I used fledermaus to make a 3D representation of the seep with sidescan and bathy combined. 3D images produced by Fledermaus not only look good but they can provide insight to how the sidescan intesity matches with the bathymetric features.
This first image is a bathymetric image that is viewed in 3D. It has a vertical exaggeration of 5x.
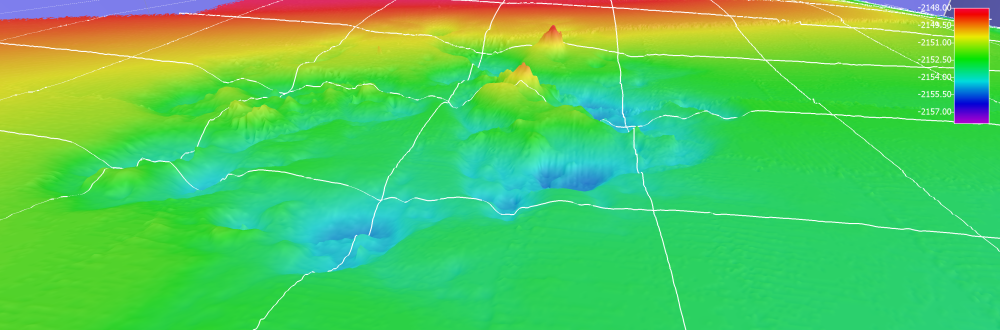
This second image is the bathy image above draped with the sidescan mosaic. It is clear to see that the steep areas are usually “darker” that the flat areas. This is because there is exposed rock or hydrates.

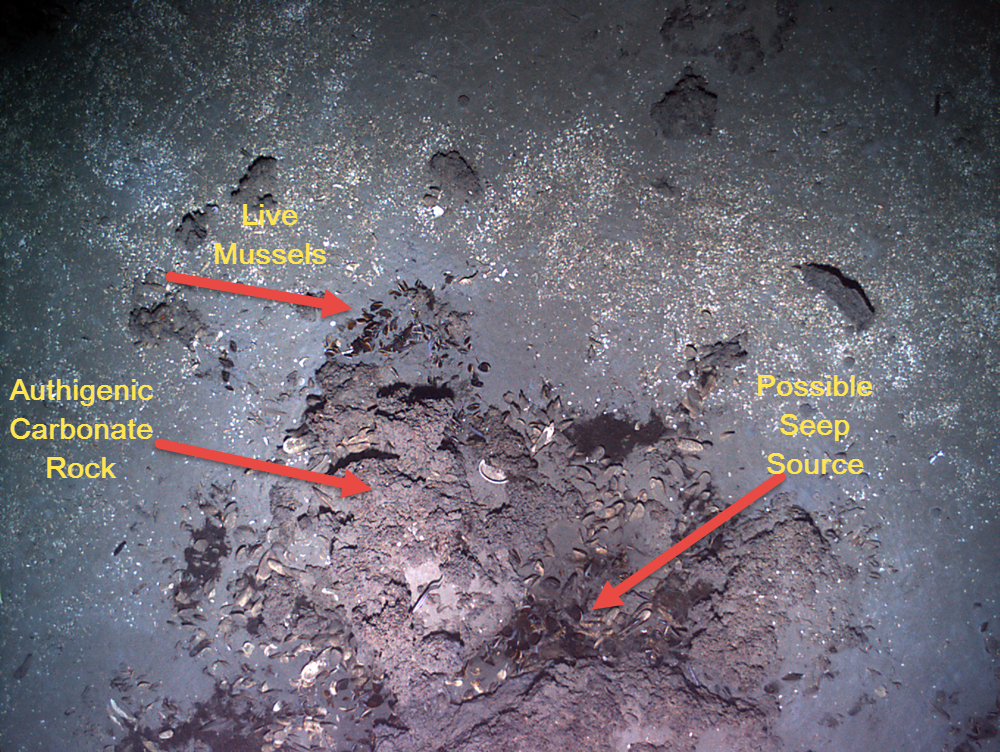
Lastly the AUV data came with a tremendous amount of photos taken from the AUV pointed down at the seafloor. This is an amazing dataset and we rarely use photos in oil & gas surveys. Below is an example of a one of the photos in the area. I've pointed out what I “know” but it turns out I'm not a marine biologist.
Recent Comments