Thanks to NOAA and the Okeanos Explorer cruise EX1205L1 we have excellent imagery of gas seeps occurring right off the Carolina coast1. The Okeanos Explorer ran several lines over two areas of seeps using its Kongsberg EM302 multibeam to survey. They also recorded water column data. The entire dataset is available from the NGDC. The Okeanos Explorer also deployed the WHOI Sentinel AUV over the seeps. I was able to get that data as well. In this blog we will take a quick look at the seeps acquired by the Okeanos.
This a “stacked” view of a seep – several pings smashed together, basically a along the vessel track view of the seep. It is located in the In the 7102 block of the Marmer Protraction area on the Cape Fear Diapir. It is “bent” in the water column due to currents. In the Gulf of Mexico the water column signature are generally much straighter. On the east coast the Gulf Stream seems to have an effect on the gas in the water column..

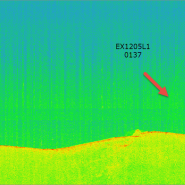
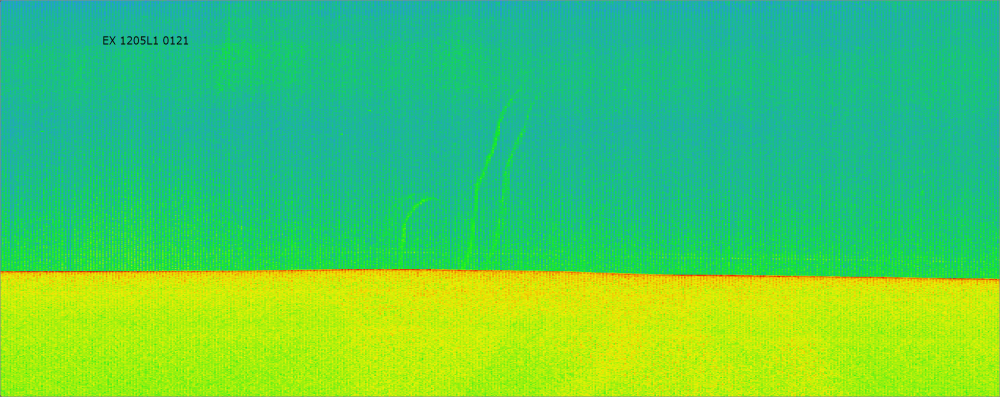
The second view of this seep is directly from the multibeam itself. This is a single ping and represents the view perpendicular to the ship's motion.
The bathymetric data shows that this seep emanates from a cone like feature. It is unclear why this is the case. I do have high resolution AUV data from this area but I haven't interpreted it yet.

The second area of seeps that the Okeanos found is not a point source like the first seep above. They are located in block 6537 of the Richardson Hills Protraction area in the Blake Ridge Diapir area. In this area there seems to be many seeps arranged in a linear fashion along an area of undulating seafloor. It could be that faults penetrates the sea floor and the gas is seeping up this fault.
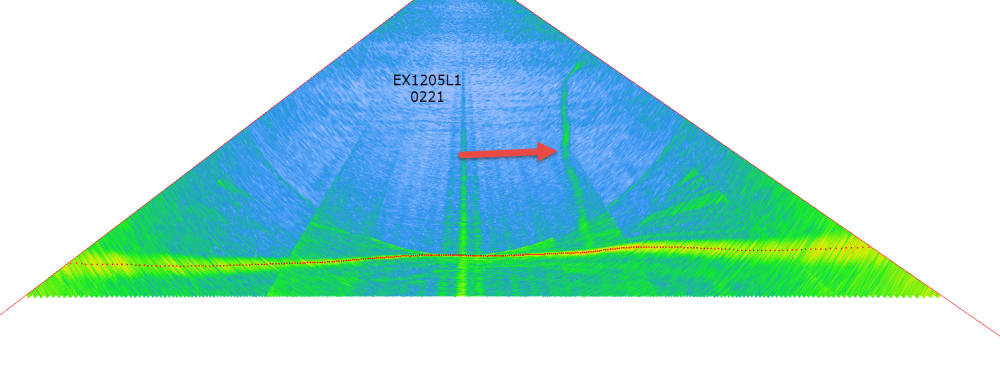
Again the stacked view.
The view perpendicular from the vessel shows a single seep; however, there are many seeps in this area.

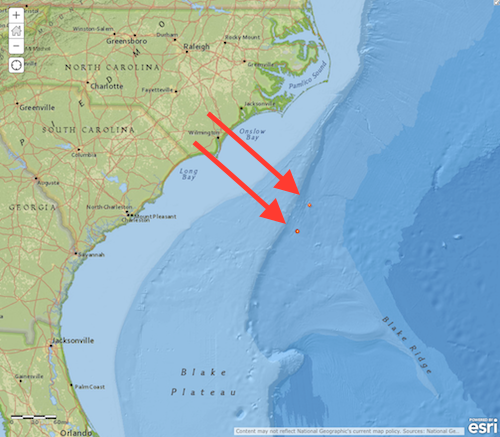
This map shows the distribution of the seeps. The seeps trend North and South.

In this exercise I just found the seeps in the Okeanos data. There are several other things that need to be done to figure out the origin of the seeps. My next step is going to be to process the high-resolution sonar data that was acquired over these seeps by the Sentinel AUV. There is also 2-D public seismic data from the 70's that could show some larger regional features.
It isn't clear if these seeps are related to an oil and gas reservoir or from biogenic sources. Most of the scientific literature seems to indicate that the gas is from shallow hydrates. The question is therefore where are the hydrates from.
1 NOAA Office of Ocean Exploration and Research (2012): Water Column Sonar Data Collection (EX1205L1, EM302). National Centers for Environmental Information, NOAA. Doi: 10.7289/V5BR8Q49 [accessed January 2016]
Recent Comments